MindGraph: From data to insight 🧠
Whether you're interested in defining and scoping a project, building ETL pipelines and crafting BI reports or developing predictive models, MindGraph can support you within a broad range of data-related tasks.

Whether you're interested in defining and scoping a project, building ETL pipelines and crafting BI reports or developing predictive models, MindGraph can support you within a broad range of data-related tasks.
Data is almost never perfect, but that doesn't deter me from using it to extract valuable insights. By combining your domain knowledge and my data expertise, we can test your hypotheses in practice, highlight important conclusions and recommend actions to address pressing challenges. Below, you can find some of the services offered by MindGraph:
Project scoping
Identifying your needs and how you can achieve your goals with your given resources
Extract, transform & load (ETL)
Sourcing and combining data from different sources in a meaningful way
Data analysis
Applying statistical methods to test your hypotheses or measure effects
Data visualization
Creating sleek charts that help you communicate your data effectively
Business intelligence & reporting
Building interactive BI solutions that automate your reporting portfolio
Predictive modelling
Applying statistical/machine learning (ML) models to predict important outcomes
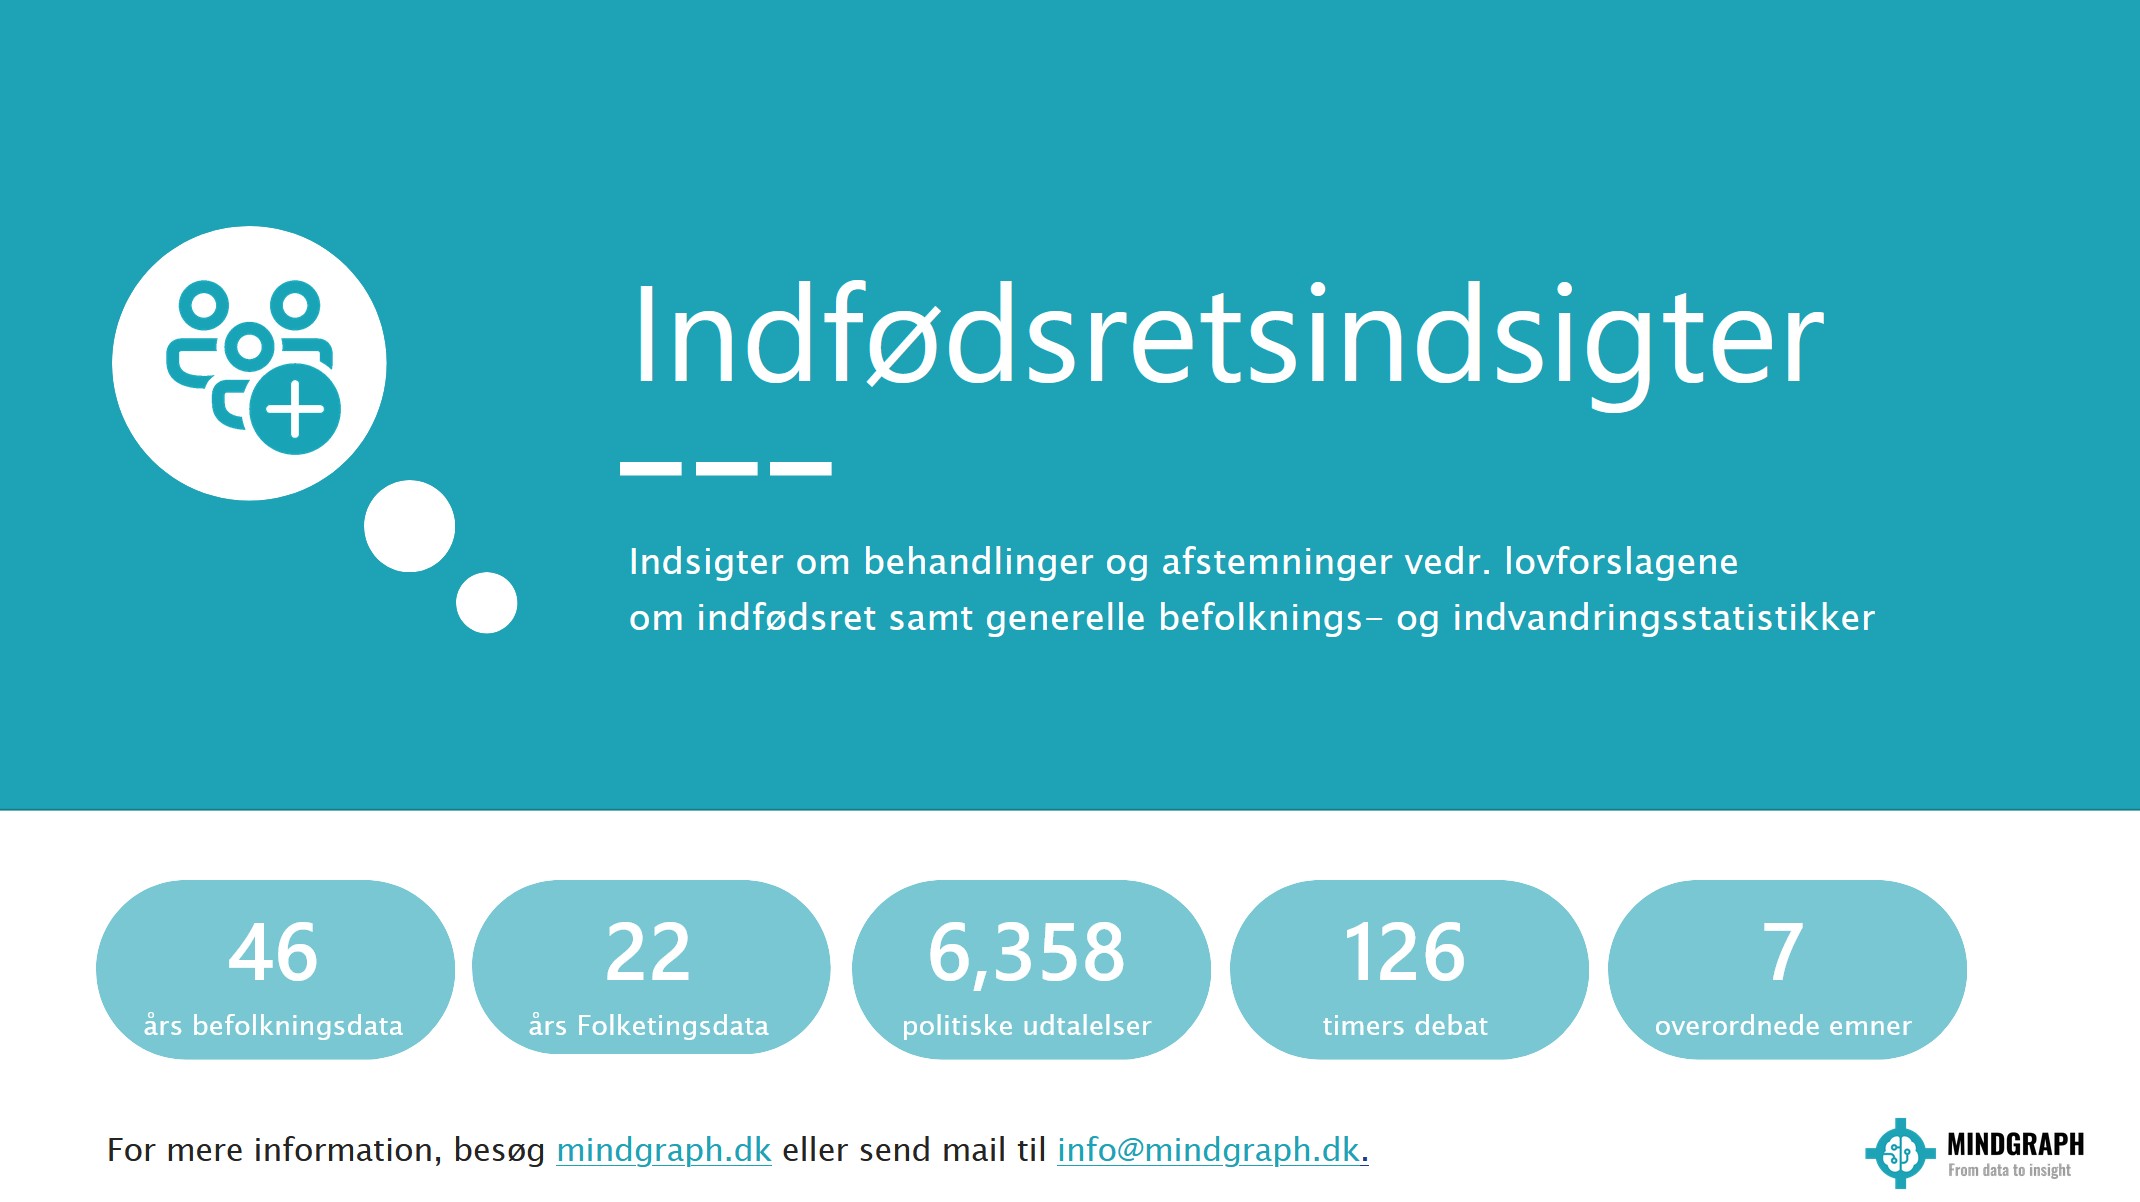
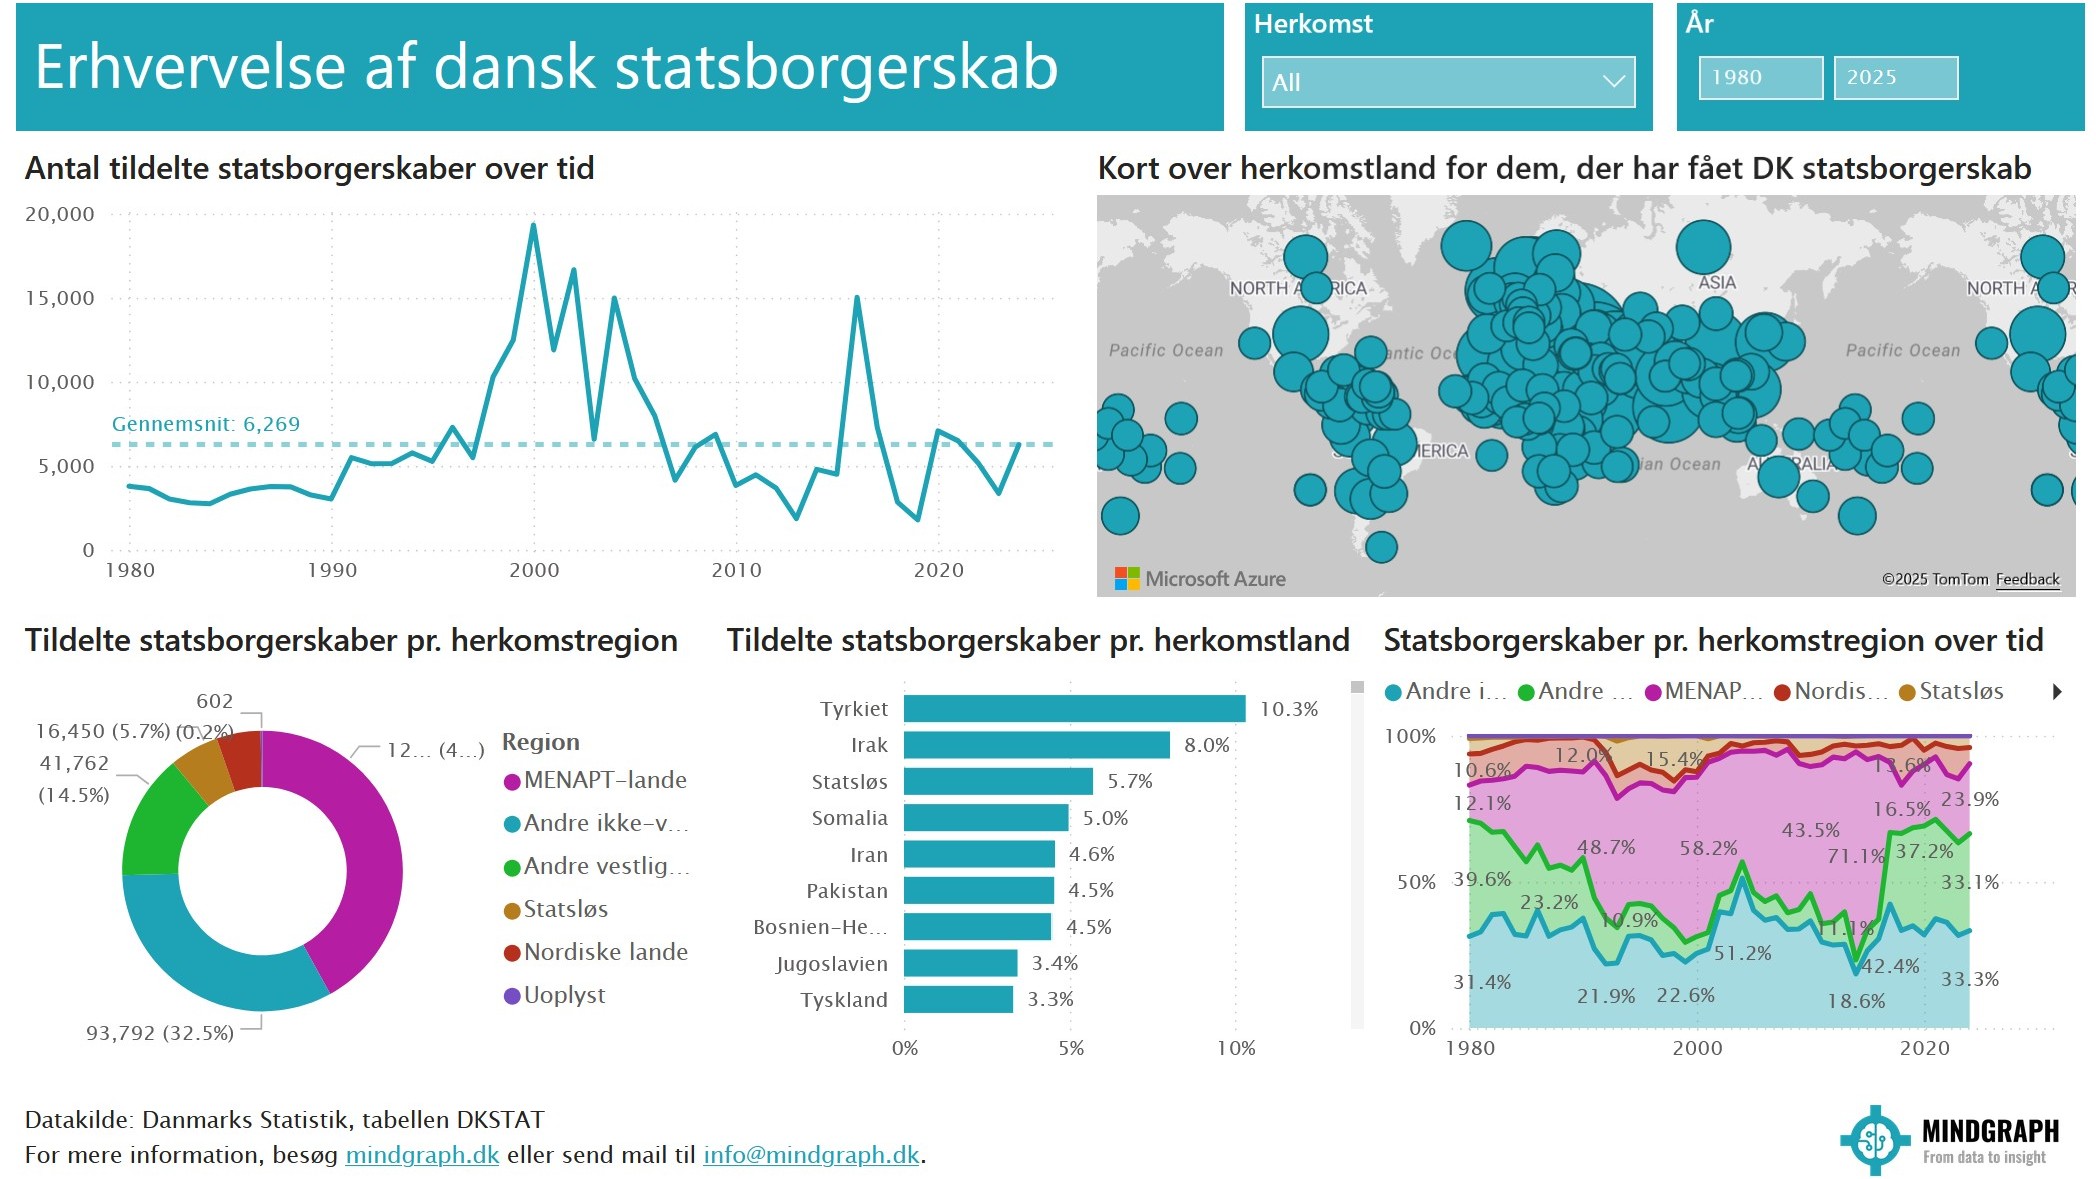
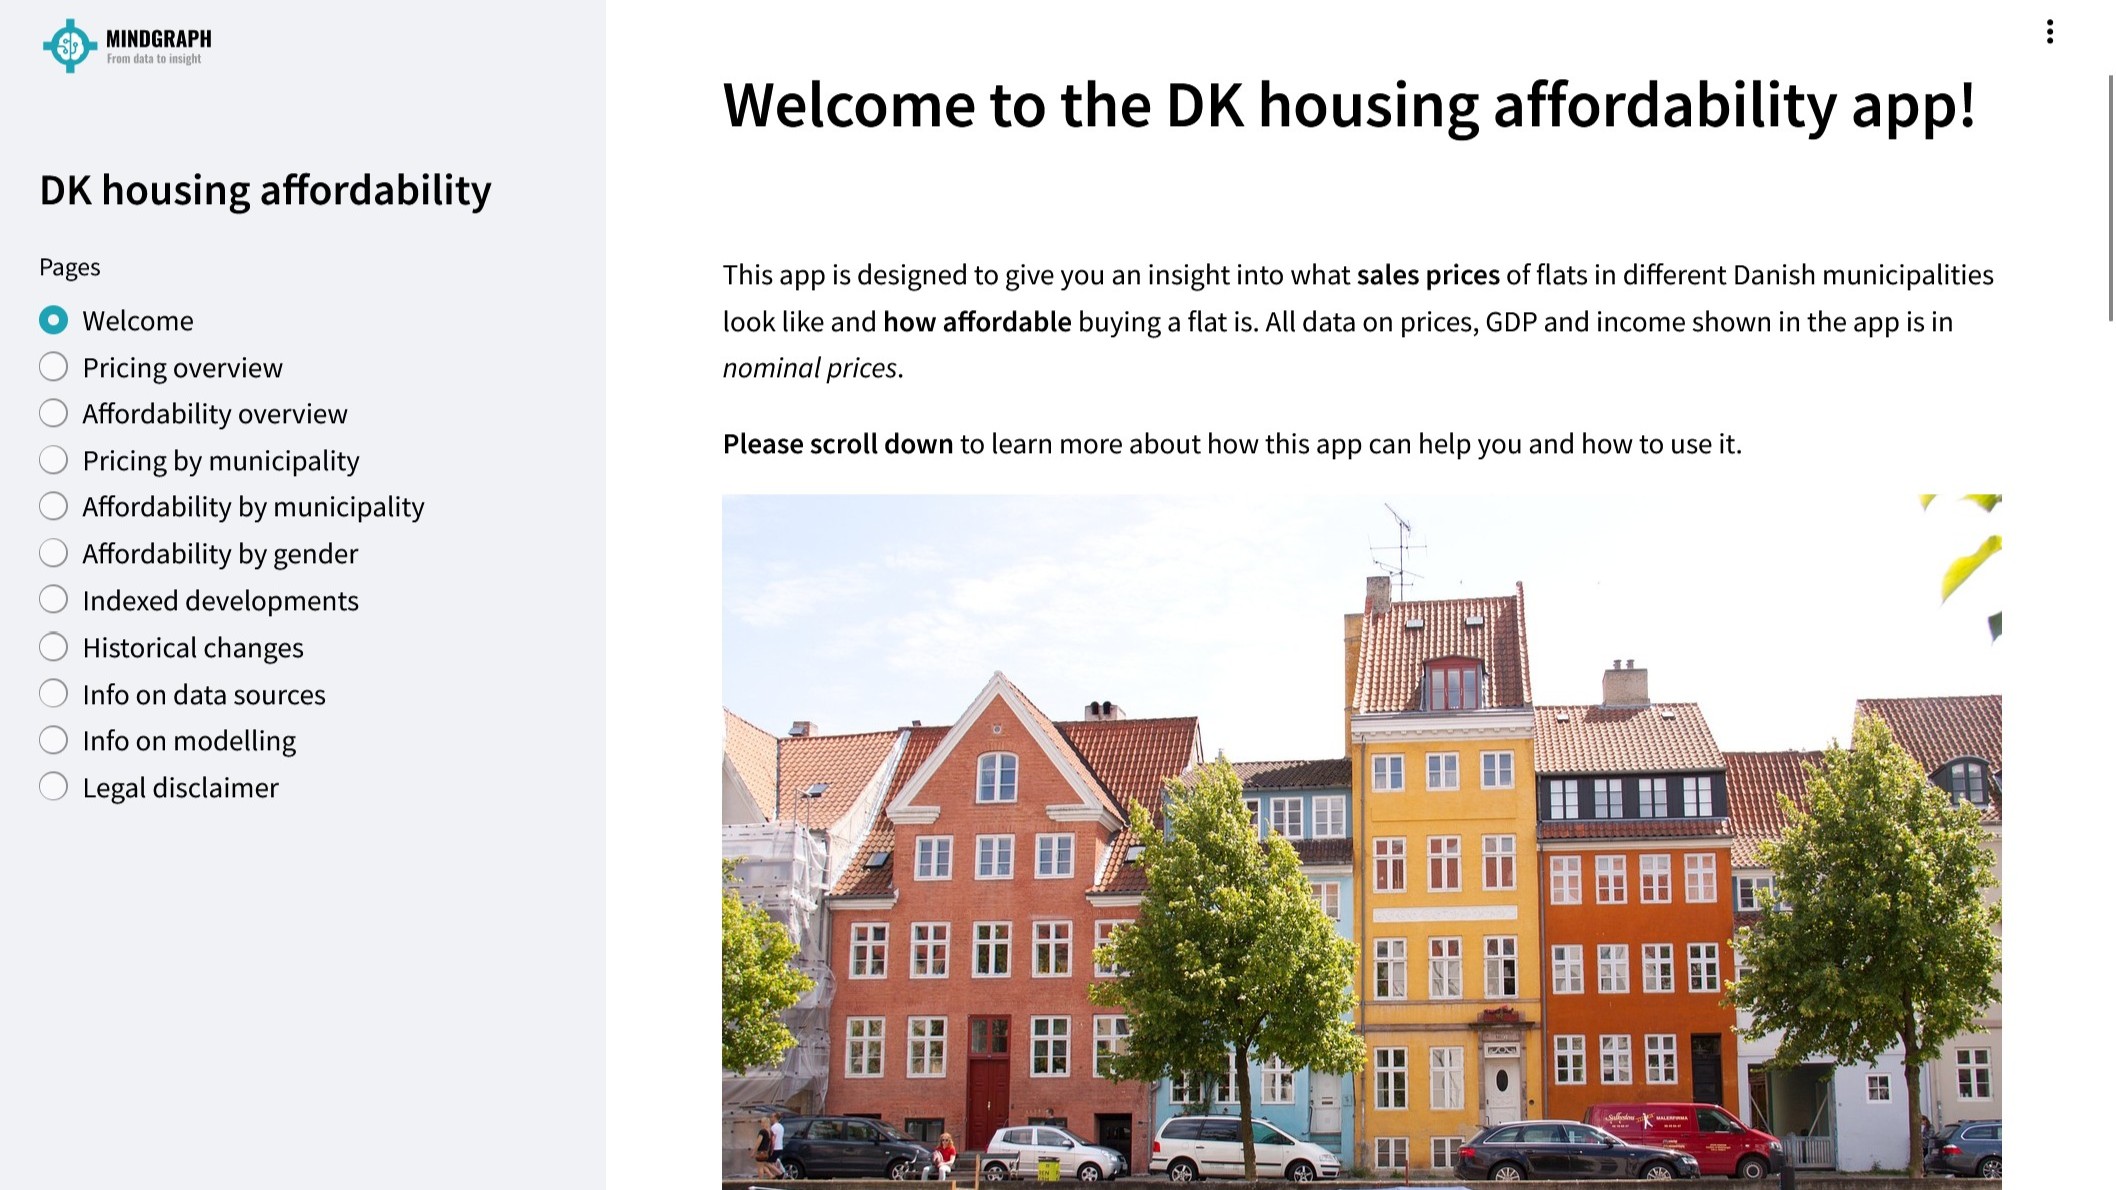
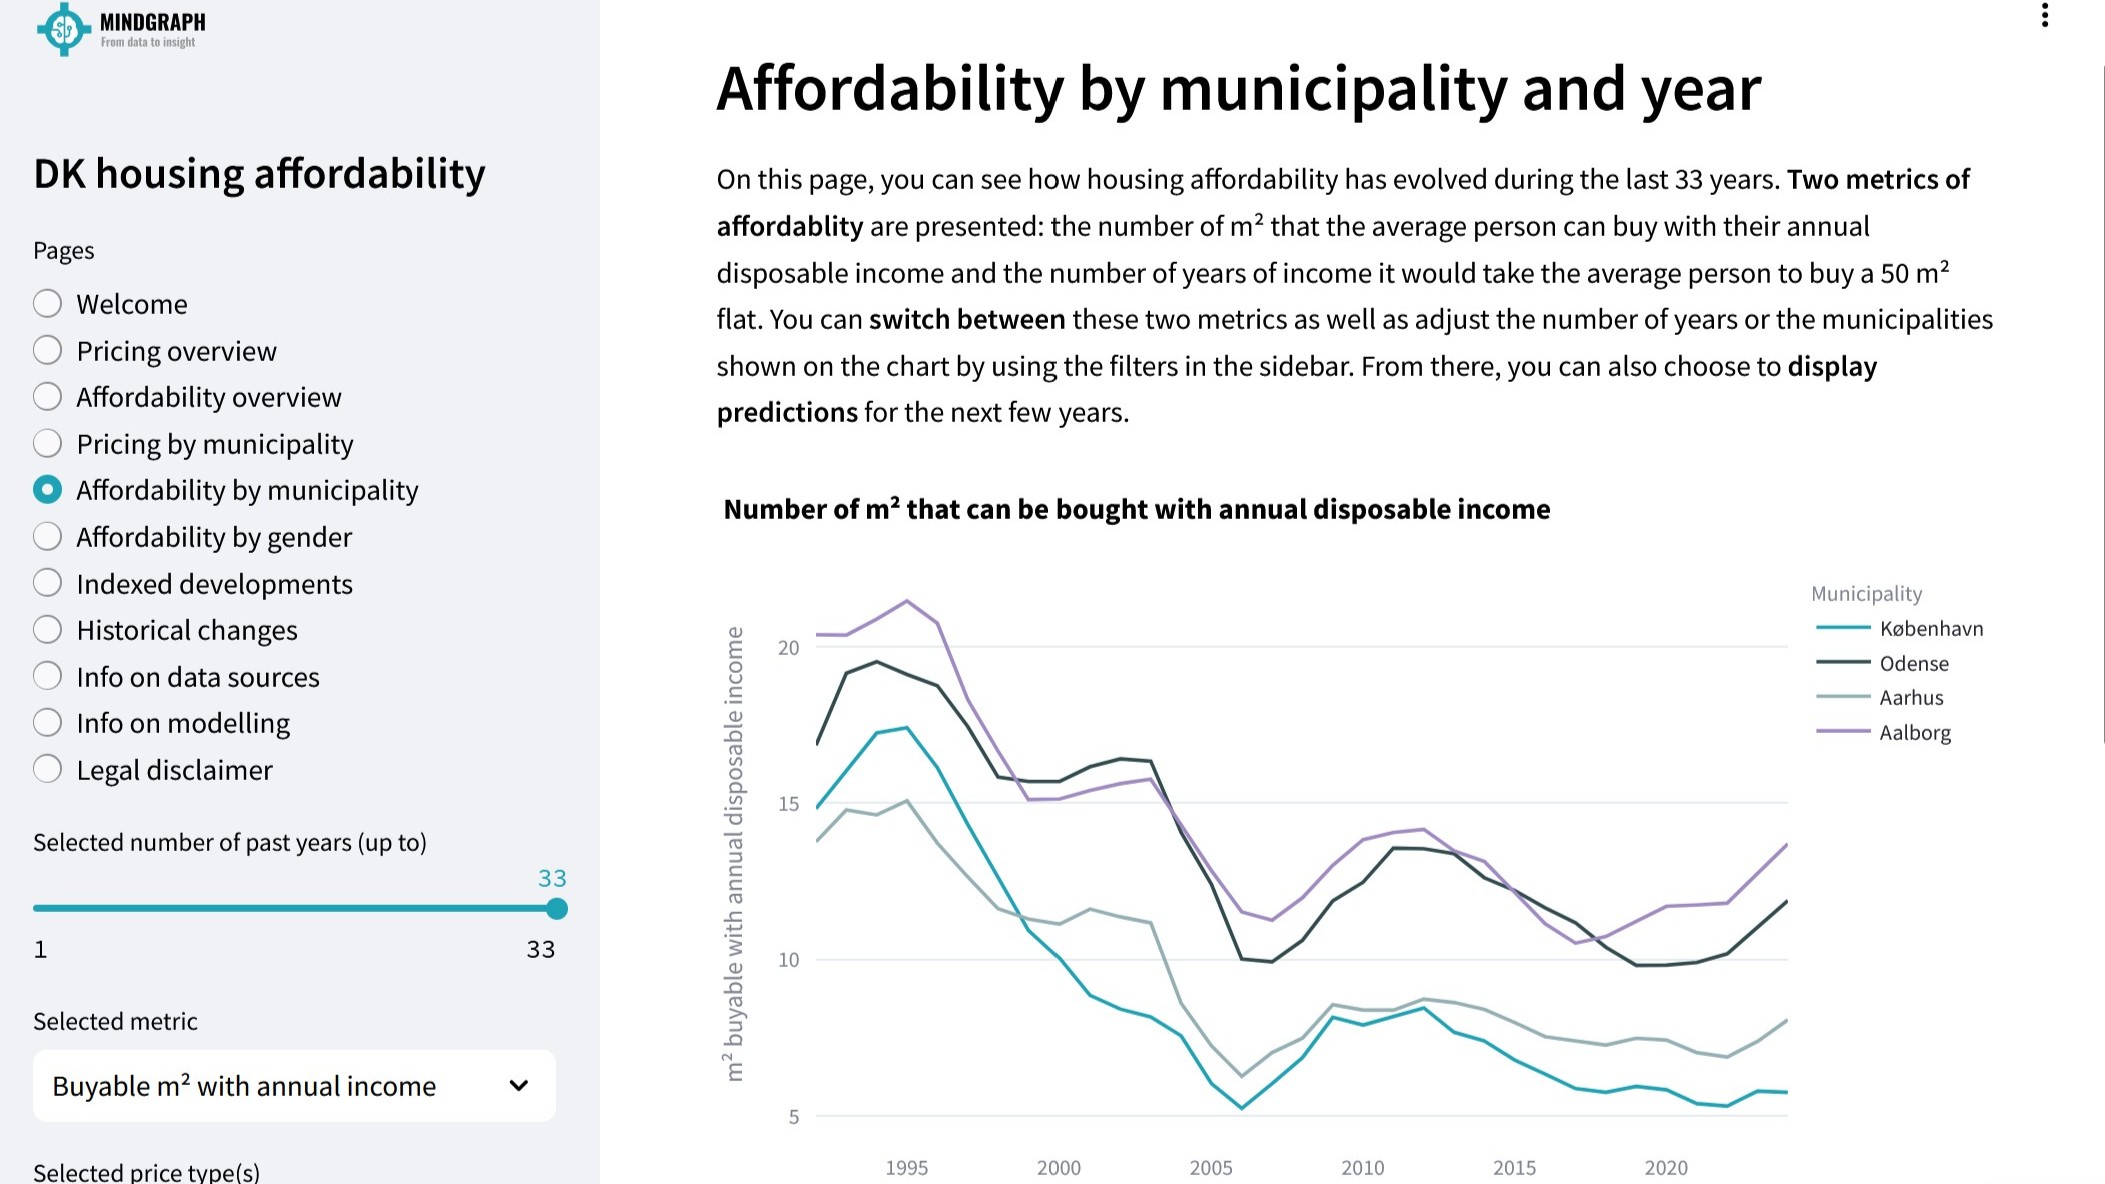
In addition to working on client projects, MindGraph has also been involved in initiatives that benefit the general public. This applies, among other things, to projects with a focus on the housing market, public transport and national well-being. Visit the blog to learn about the individual projects and to see examples of the things MindGraph could do for you.
My name is Kiril, and over the past 5 years I have been responsible for both data collection, processing and analysis. I have helped to automate data processing and reporting, as well as create statistical and ML models to generate forecasts and shed light on relationships in the data. I have extensive experience with Excel, Power BI, R and Python. I like the nerdy, back-end parts of the process as much as meeting with people to present and discuss the implications of my analysis. Feel free to take a look at my LindedIn profile and add me to your network.


Do you prefer to send an e-mail? That's perfectly alright, just drop me a line at info@mindgraph.dk and I'll get back to you shortly thereafter 😊