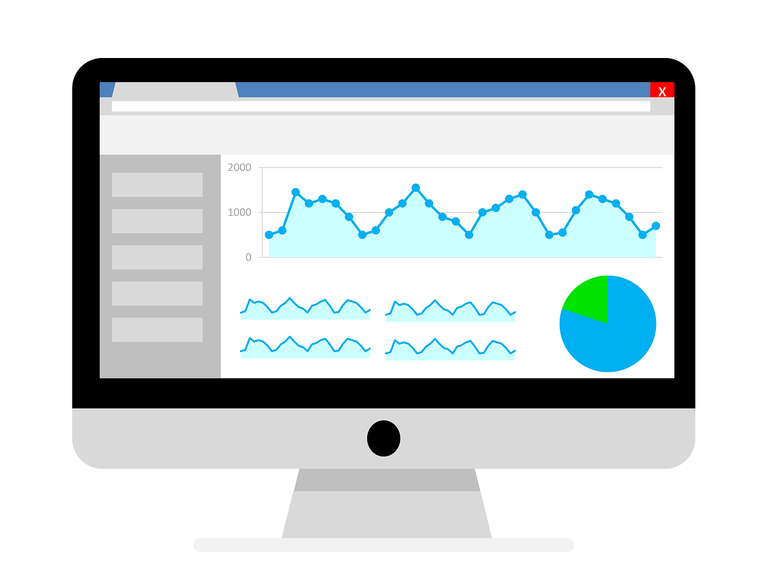
MindGraph covers a wide array of tasks ranging from data collection, transformation and analysis to presenting insights and onboarding users to interactive tools and reports. My unique experience has thought me the importance of relating data to a business context and designing products that are tailored to the end user's needs, also when that user is a non-technical person. Below, you can read more about which areas MindGraph can help you in.
Whether it comes down to conducting a one-off analytics project, building a data pipeline or designing an interactive business intelligence solution, I can help you translate your business needs into a project specification. Together, we can define the scope of the final product, estimate the resources needed to achieve your goal, identify opportunities for improvement and mitigate any potential risks.
To be able to transform data into powerful insights, it is necessary to set up a proper Extract, Transform and Load (ETL) pipeline. By linking data from different sources and transforming it according to rules relevant for your business, you can build a solid fundament for your reporting, business intelligence or statistical/machine learning modelling, regardless of whether you use R, Python, Power Query or DAX.
The way to unlocking the potential of your data often starts with getting to know your data and what better way to understand your data than to visualise it in a way that's meaningful to your organisation?
Whether you want to track real-time metrics or follow important developments in quarterly or annual KPIs, identify difference between different categories of products, customers or employees, an interactive, automatically updated report can facilitate you in achieving your goals.
While data visualisation is a great way to start exploring the potential of your data, a chart is seldom sufficient to tell you the story behind what you see on it. To dig deeper and ensure that the insights you're getting have a solid backing, it is often useful to do some sort of hypothesis testing or study the impact of different factors on the metric you're interested in explaining.
With the right kind of statistical analysis, you will not only be able to discern between apparent and real patterns but also measure important differences and effects observed in the data.
Data-mature organisations use a mixture of approaches to extract the most value from their data and stay competitive. With the recent explosion in generative AI, the edge that applying methods more sophisticated than traditional statistical analysis has been getting the spotlight. In reality, both machine learning (ML) and traditional statistics can be useful when it comes to building predictive models.
The choice of whether to use one thing or the other will often depend on your circumstances, such as the quality and quantity of the data you have available. Either way, having a predictive model at your disposal can be a powerful tool to supercharge your decision-making.
If you find yourself in a situation where either you or someone else in your company feels unable to use the outputs of your analytics/data science team, then you may benefit from a proper introduction to those tools and the concepts they build upon.
Whether you're interested in improving the data culture of your department, communicating your valuable insights in a more user-friendly way, onboarding users to interactive analytics tools or even getting to know the basics of modern data analytics and programming, MindGraph can support you on your journey.
Drop me an e-mail or use the button below to get a free, no-strings-attached 30 minutes meeting where we can discuss your needs and do some initial project scoping.