Statistical analysis and hypothesis testing
Building a solid data foundation and reporting on trends and patterns found in the data is an important step towards creating a data-driven culture. However, moving to the next level requires developing an understanding of what drives the trends and patterns we observe in the data, something that requires a more sophisticated approach. That is where using some "good old" statistics may prove to be extremely helpful.

Why should I care about statistics in 2024? 🧮
With all the talk on artificial intelligence (AI), large language models (LLMs) and machine learning (ML), statistics may sound like a thing of the past. But in reality, statistics is still as relevant in today's fast-changing data landscape as ever, and it can be a powerful tool when employed correctly.
Here are a few things that applying statistical methods can be useful for:

How does statistics compare to machine learning? 🤖
Compared to more complex algorithms such as ML models, statistics offers an easier and more intuitive explainability of its results and as such, it allows us to get a better understanding of why a certain number is the way it is (provided that we have enough meaningful data).
Below is a quick comparison of statistics and machine learning, highlighting the things the two approaches are best at:

Isn't statistics too complicated? 😱
It can be, but the good news is it doesn't have to be! While the tools used by statistics may involve complex formulas and assumptions, with modern tools such as R and Python, it is possible to quickly and easily obtain and interpret the results of various statistical tests.
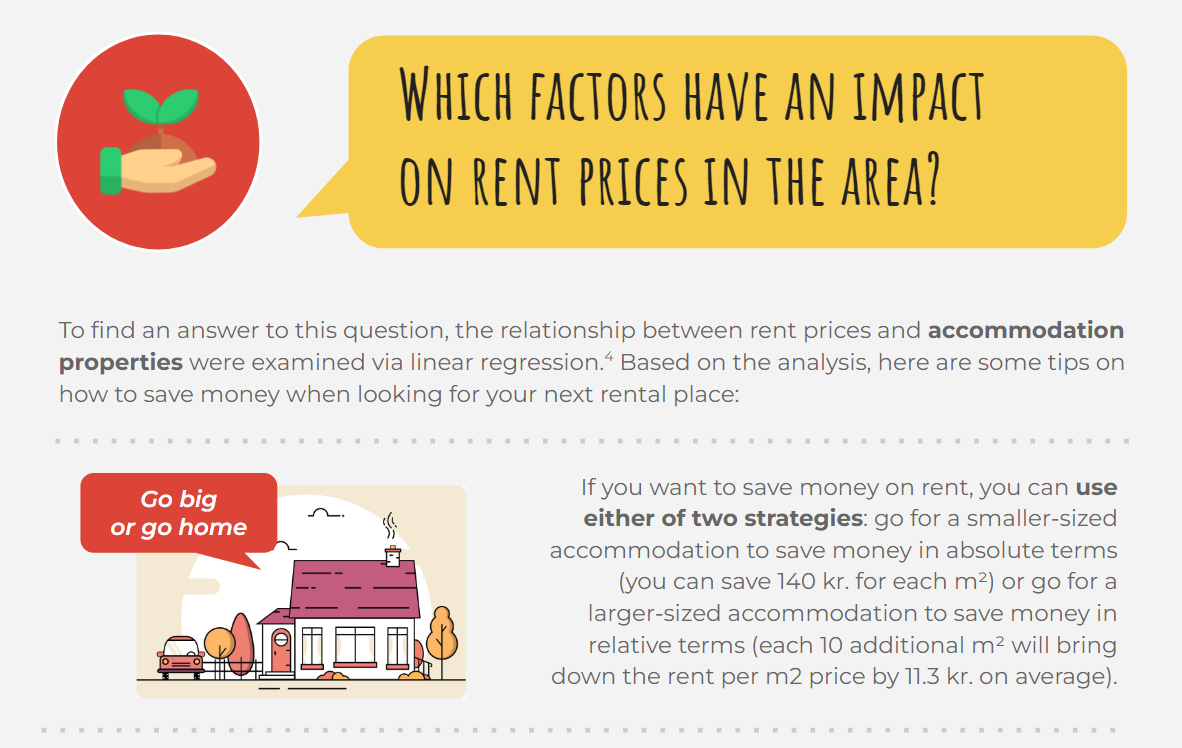
Of course, presenting the findings can be challenging and at MindGraph, I realise the importance of communicating statistics in a way that's suited to the level of technical understanding of the audience. Below is an example from one of my earlier projects, where I applied a series of statistical models to test assumptions related to the housing market in the Greater Copenhagen area:
Ready to apply statistics to your data? 👓
If you're mulling over the potential of applying statistical methods to your data so you can measure important effects or test different hypotheses you might have, feel free to reach out for a free, no-strings-attached 30 minutes meeting where we can discuss your needs in more detail, feel free to reach out for a free, no-strings-attached 30 minutes meeting where we can discuss your needs in more detail: